
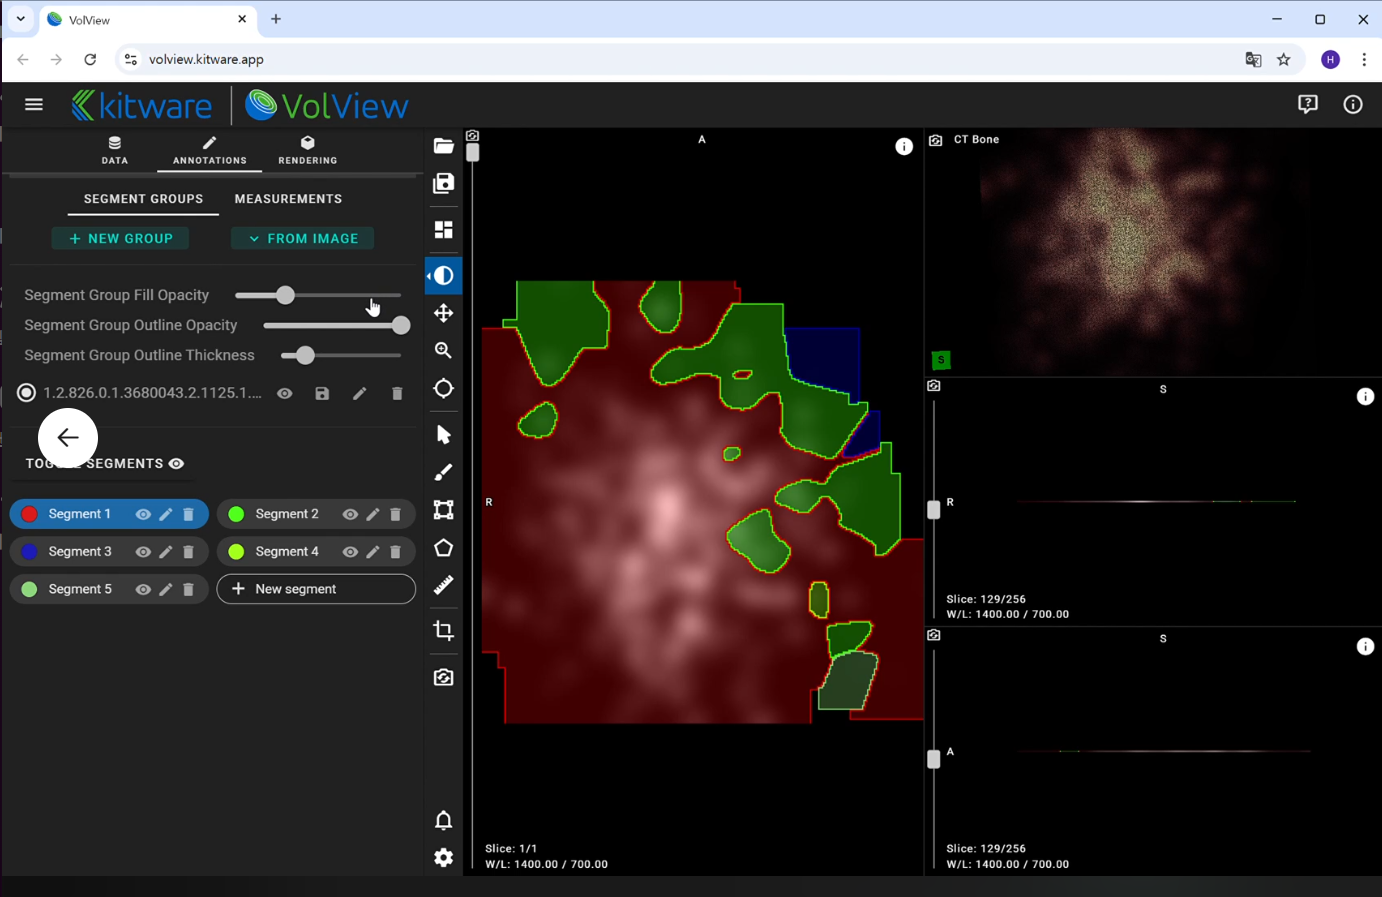
Given a CSV file containing category names, (x, y) coordinates, and density values, generate a heatmap-based DICOM Image and DICOM Segmentation files for visualization in VolView.
Steps:
- Data Normalization:
- Normalize x, y coordinates to the range [0,1].
- Normalize density values using the formula: df[“z”] = np.log1p(df[“z”] - zmin) / np.log1p(zmax - zmin)
- Category-wise Density Accumulation:
- Generate heatmaps for each category by applying Gaussian smoothing with sigma = 0.025.
- Tagging Based on Maximum Density:
- Assign a Tag to each heatmap coordinate, corresponding to the category with the highest density at that point.
- Integrated Heatmap Generation:
- Use the assigned Tag values to create a single integrated heatmap.
- Normalize the heatmap values using
normalize_heatmap_with_log1.
- DICOM Image Creation:
- Convert the normalized integrated heatmap into a DICOM Image file that can be loaded in VolView.
- DICOM Segmentation Generation:
- Create DICOM Segmentation (DICOM SEG) files for each category, mapping the segmented regions accordingly.
Expected Outputs:
- DICOM Image file (
heatmap.dcm) containing the normalized integrated heatmap. - DICOM Segmentation file (
segmentation.dcm) containing category-based segmentation maps.